Workforce

Dec. 2025 Preliminary Labor Statistics as of 1/23/2026

Volusia County
Workforce Size

266,695

Volusia County
Employed

252,728

Volusia County 
Unemployed

13,967

Volusia County
Unemployment Rate

5.2%

Source: U.S. Department of Labor, Bureau of Labor Statistics, Local Area Unemployment Statistics (LAUS)

The January 2026 labor data preliminary stats release is TBD. 

Quick Links:

Volusia County, Florida, U.S. Unemployment Trend

The chart shows the unemployment rate trend for Volusia County, Florida, and the US from January 2020 to present. After the impact of COVID and an initial rate of 15.1%, Volusia County's unemployment rate had a steady decrease throughout 2021 and 2022.  The rate remained relatively steady in 2023, averaging 3.3% for Volusia and averaging 3.8% in 2024. The rate as of December 2025 was 5.2%. Florida’s unemployment rate was 4.4% and the U.S. was 4.1%.

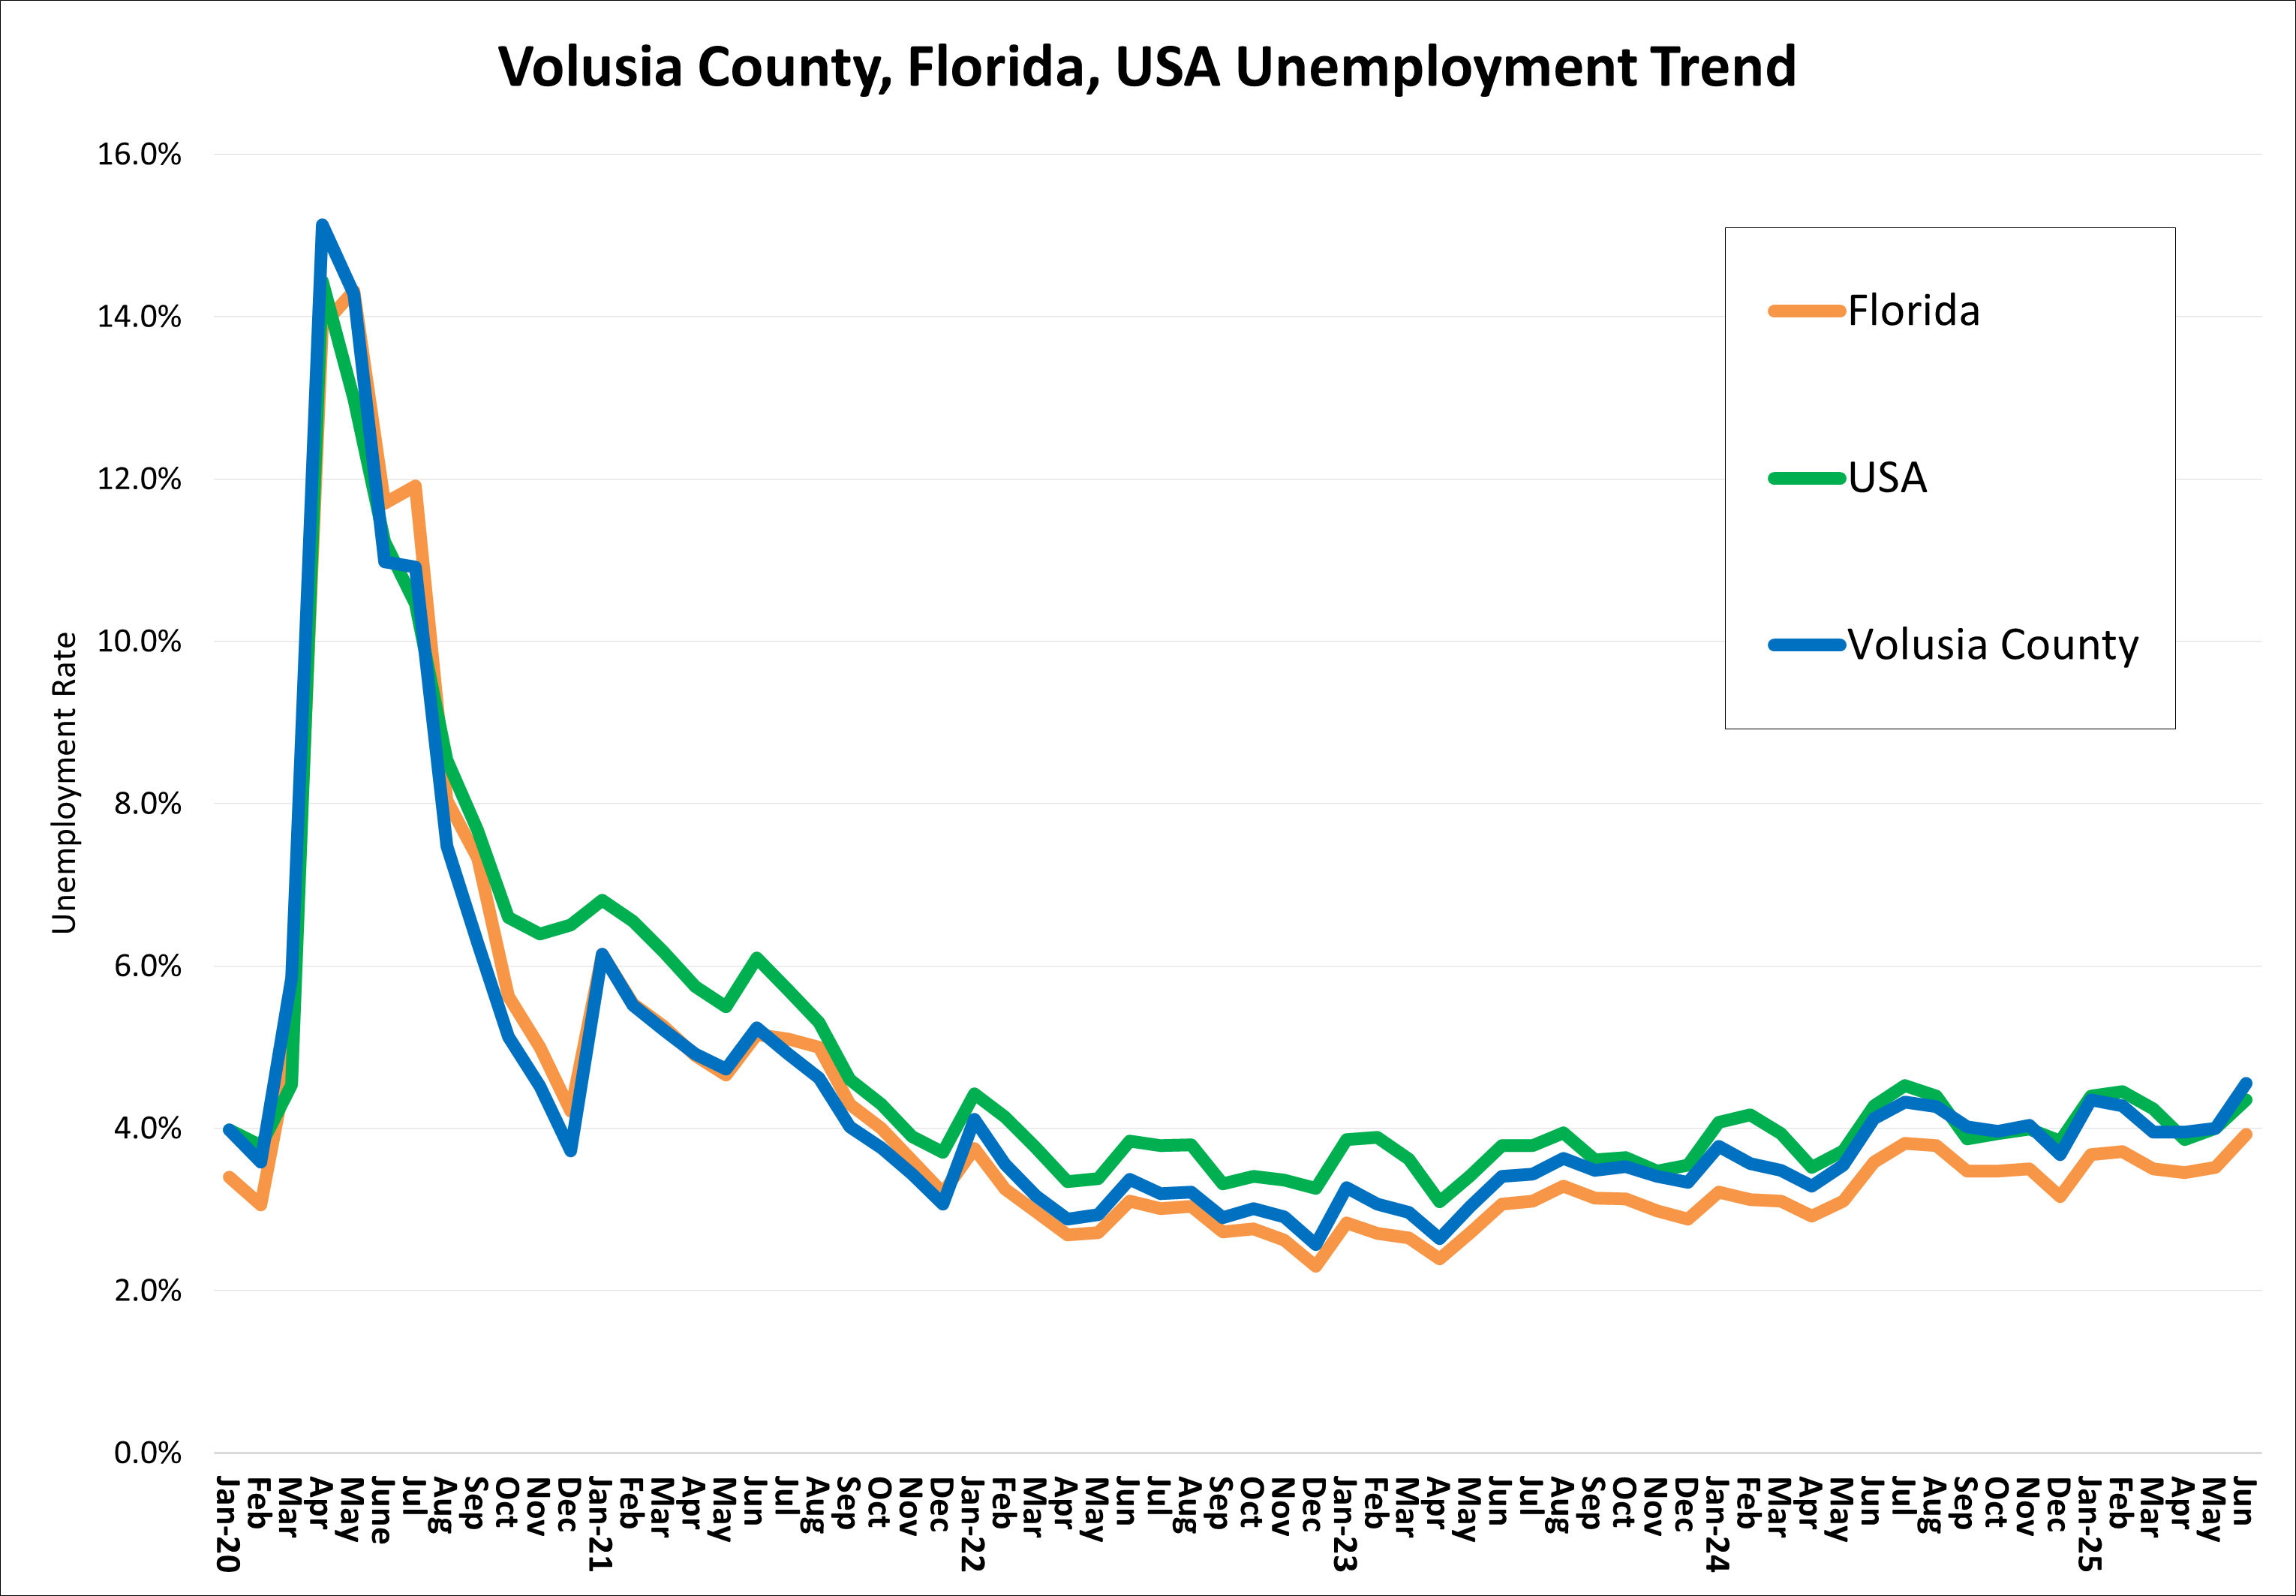
Source:  FloridaCommerce, Local Area Unemployment Statistics (LAUS) program.

Area Employment by Major Industry

For a complete overview of area employment and labor statistics, view the "Q" report here.

The chart shows the employment levels by the major super sector industries for the 2nd quarter of 2025. A comparison of the same industries for the 2nd quarter of 2024 indicates either a gain or loss for each industry. Health Care and Social Services 34,976 gain of 1,145. Leisure and Hospitality 30,079 gain of 123.  Retail Trade 27,884 loss of 285. Professional and Business Services 19,462 loss of 419. Educational Services 15,375 loss of 140. Construction 12,886 gain of 1. Manufacturing 11,706 loss of 114. Public Administration 9,912 gain of 304. Financial Activities 8,599 gain of 318. Transportation, Warehouse, and Utility 5,809 loss of 110. Other Services 5,586 gain of 41. Wholesale Trade 4,907 gain of 13. Natural resources & mining 1,339 loss of 8. Information 1,248 no change. Unclassified 87 loss of 293. Total employment 189,857 with a net loss of 722.


Average Workforce Size

Volusia County available total workforce reached record levels of approximately 271,253 in 2023 and has since reduced by 1.5% to 267,243.

The chart shows Volusia County’s total workforce from 2015 to 2024 based upon the average monthly workforce each year. 2015 – 238,316. 2016 – 245,272. 2017 – 250,450. 2018 – 253,439. 2019 – 254,312. 2020 – 249,559. 2021 – 255,093. 2022 – 266,061. 2023 – 271,253. 2024 – 267,243

Go Back


Average Employment

Volusia County total employment workforce reach record levels of approximately 262,386 in 2023, surpassing pre-pandemic levels in 2019, and has since reduced by 2.1% to 256,985.

The chart shows Volusia County’s total employed workforce from 2015 to 2024 based upon the average monthly workforce each year. 2015 – 224,339. 2016 – 232,868. 2017 – 239,348. 2018 – 243,967. 2019 – 245,545. 2020 – 230,585. 2021 – 243,303. 2022 – 257,682. 2023 – 262,386. 2024 – 256,985.

Go Back


Average Unemployment Rate

Volusia County unemployment dropped to a average rate of 3.3% in 2023. In 2024, the average rate increased to 3.8%.

The chart shows Volusia County’s average unemployment rate from 2015 to 2024 based upon the average monthly workforce each year. 2015 – 5.9%. 2016 – 5.1%. 2017 – 4.4%. 2018 – 3.7%. 2019 – 3.4%. 2020 – 7.6%. 2021 – 4.6%. 2022 – 3.1%. 2023 – 3.3%. 2024 – 3.8%.

Go Back


2024 Average Private Annual Wage

Volusia County

$53,372

Florida

$69,296

U.S. 

$75,585

Source:  FloridaCommerce, 2024 Quarterly Census of Employment and Wages program, released December 2025.

Private Average Annual Wage

Volusia County wages are reasonable and able to support a quality of life that continues to draw people to our communities.

The chart shows Volusia County’s average annual wage trend from 2015 to 2024 and sustained a 10-year average percent increase of 4.37% and a 4.1% increase from 2023 to 2024. Average wage by year beginning with 2015 was $35,904. 2016 - $36,558. 2017 - $37,740. 2018 - $38,760. 2019 - $40,472. 2020 - $43,673. 2021 - $46,385. 2022 - $49,175; 2023 - $51,246, and 2024 - $53,372.

Go Back


Regional Average Annual Wage Comparison

Volusia County wages are regionally competitive allowing businesses to attract the talent they need.

Volusia County ranks 31st out of 67 counties for the private average annual wage. The chart shows the regional counties 2023 private industry average annual wages for comparison to Volusia County.  Flagler - $47,071 an increase of 5.1% from 2022. Putnam - $47,605 increase of 3.4%. Lake - $50,032, increase of 3.7%. Volusia $51,246, increase of 4.2%. St. Johns - $59,262 increase of 5.0%. Seminole - $63,188 increase of 4.2%. Orange - $64,659 increase of 4.3%. Brevard $64,997 increase of 5.2%.

Go Back


Private Industry Average Wage by Super Sector

Volusia County wages are appropriate for your business and the industry sector you compete in.

The chart shows the 2023 Volusia County Private Industry Average Annual Wage by Super Sector. The highest average wage was in the Information sector at $83,577. Financial Activities $73,701. Health & Social Services $64,139. Manufacturing $62,555. Professional and Business Services $62,321. Construction $57,538. Educational Services $50,413. Trade, Transportation, and Utilities $43,283. Other Services $40,217. Natural Resources and Mining $31,794. Leisure and Hospitality $28,482.

Go Back

How can we help?

Talk to one of our local experts about your business needs.

Contact Us
Volusia County Icon